Power BI, Excel, and Notion Templates & Dashboards to Help Employees & Teams Work Faster, Avoid Mistakes, and Achieve More.
Discounts ends soon.
Exclusive Digital Solutions for Professionals – Grab 10% Off Now.
Where Bankers, Engineers, Lawyers, Business Owners, Startups, SMEs & Employees Get Dashboards, Templates, Trackers & SOPs to Work Smarter, Faster, and Error-Free.
Previous
Previous Product Image

Credit & Loan Support Toolkit

5,000.00
Next

Business Structure in a Box – All-in-One Excel System

Original price was: ₦12,000.00.Current price is: ₦4,000.00.
Next Product Image

Finance & Management Reporting Toolkit

3,000.00

Excel toolkit for finance teams to track monthly performance, budget vs actuals, departmental expenses, and product or branch profitability with automated formulas and dashboards.

Buy Now
Add to Wishlist

Description

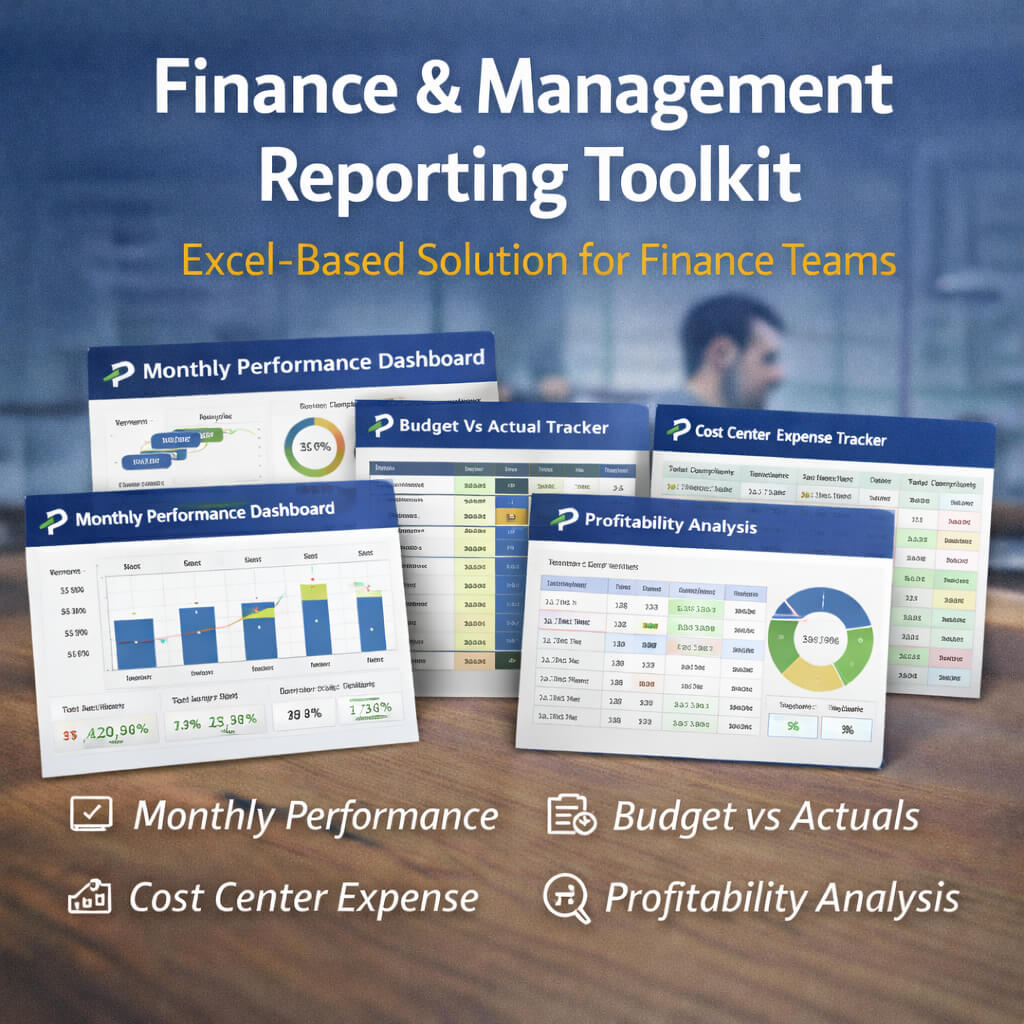
The Pengrad Finance & Management Reporting Toolkit is a comprehensive Excel solution designed for finance teams, management accountants, and operational managers to track, analyze, and report financial performance across branches, departments, and products. This toolkit provides ready-to-use dashboards, budget vs actual tracking, cost center monitoring, and profitability analysis, allowing teams to make data-driven decisions efficiently.

With built-in formulas, dropdown menus, conditional formatting, and a management dashboard, it automatically calculates variances, growth percentages, net profits, and profit margins. The toolkit is ideal for generating audit-ready reports, department-level summaries, and executive dashboards directly from Excel without relying on complex ERP systems.

Reviews

There are no reviews yet.

Only logged in customers who have purchased this product may leave a review.

Shopping cart

0
image/svg+xml

No products in the cart.

Continue Shopping