


Description
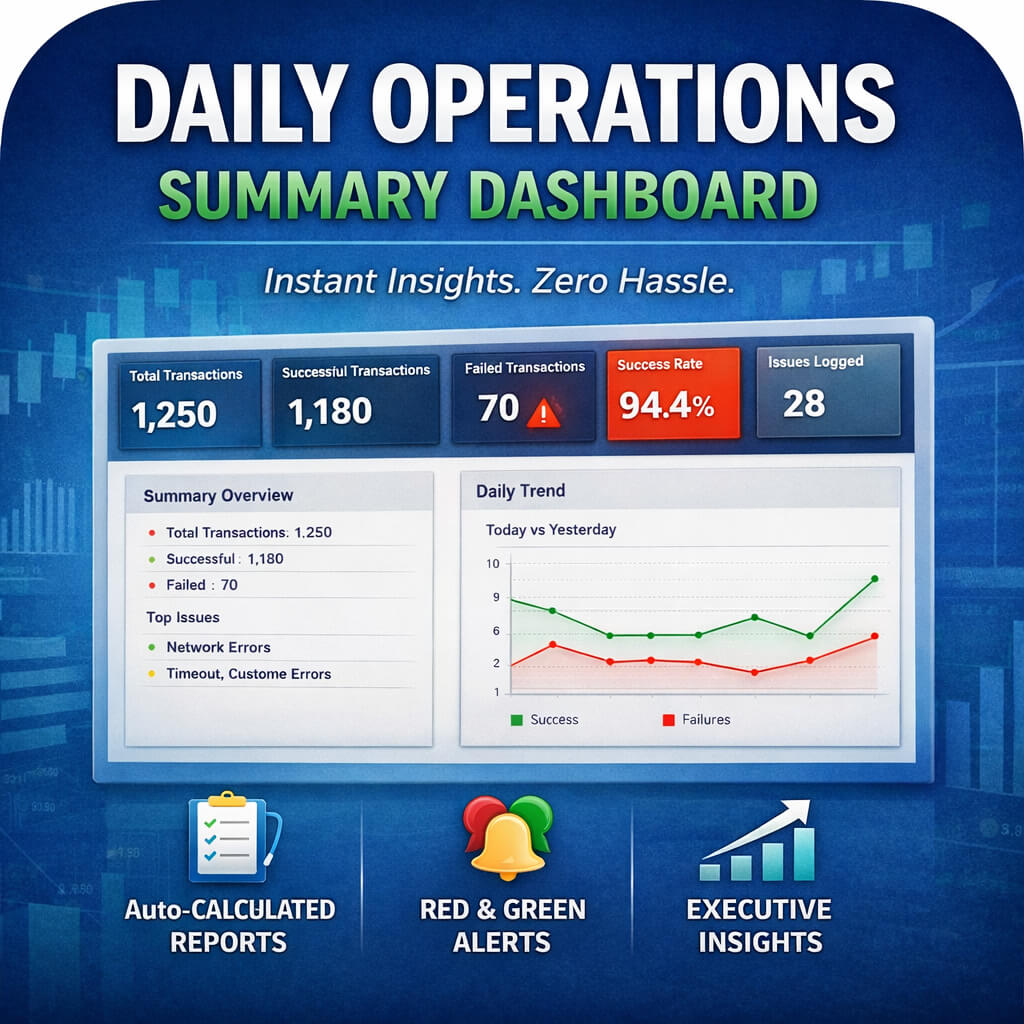
The Dashboard is a plug-and-play operations tool designed to eliminate manual reporting, end-of-day calculations, and repeated explanations to management.
Instead of spending time counting transactions, calculating success rates, or preparing summaries for meetings, staff simply paste daily transaction logs into the Raw Data sheet. The dashboard automatically transforms that data into a clean, executive-style summary that management can understand at a glance.
The tool auto-summarizes:
Total transactions processed
Successful and failed transactions
Success and failure rates
Issues logged
Daily performance trends
With built-in red/green performance indicators, managers can instantly see when operations are healthy or when attention is needed—without asking questions or waiting for explanations.
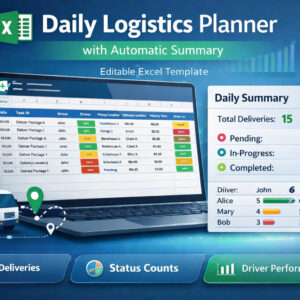
Designed specifically for fintech, payments, and operations-driven teams, this dashboard acts like a silent operations assistant—preparing reports, highlighting risks, and saving time every day.
No advanced Excel knowledge is required.
No formulas need to be edited.
Just paste data and get clarity.


Reviews
There are no reviews yet.